
Source: Roblox Creator Hub · CC BY 4.0 · View source · Code samples: MIT Imported 2026-10-03. Formatting adapted for this site.
Network usage
The MicroProfiler also lets you capture and view network traffic, which can help you identify causes of high latency and loading problems in your games.
Network data is available only in frame dumps from the desktop client or Studio, not in the real-time overlay. If you encounter lag or other issues that you suspect are network-related, that's a great time to save MicroProfiler data.
Capture network data
Open the MicroProfiler with CtrlAltF6 or ⌘⌥F6.
In the Network menu, choose High, Low, or Off.
High includes additional information on the items within a batch data packet, the task that deserialized the packet, and the asset ID for any assets in the request or response.
Low captures less data and is not as computationally intensive. Depending on your computer, selecting it can help your dumps contain a larger number of frames. This is the default level and the one the MicroProfiler uses when you profile a mobile device.
Off means that network data is not included in frame dumps.
Save MicroProfiler frame data and open the generated HTML file.
Basic navigation
After you open the MicroProfiler dump in a web browser, select X-Ray / Network. Two more rows appear below the frame time graph:
- The top row is received traffic (downloads).
- The bottom row is sent traffic (uploads).
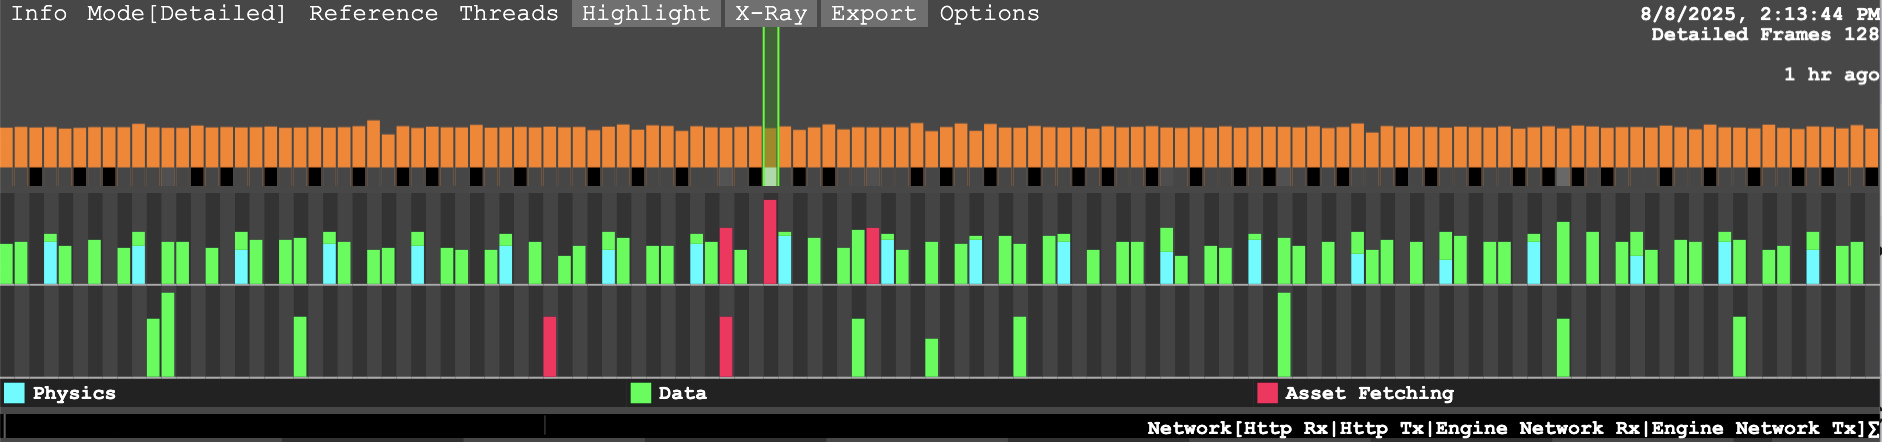
Because network traffic can vary dramatically between frames, you might see a couple spikes and seemingly very little else. In this case, select Options / Log Scale Graph to change the scaling of the bars such that they scale logarithmically rather than linearly, which makes small bars more prominent.
The stacked bars are colored not by severity, but by type of traffic: physics in blue, data in green, and assets in red. Hover over any bar to get the amount of received or sent traffic for that frame. Right-click to show the Network events window, which shows much more detailed information.
Network events window
The Network events window shows individual events within the scope of the frame. Click on any event for more detailed information.

Available information depends on the type of packet and verbosity level:
Engine network batch data includes traffic due to streaming, instance property updates, and events. If you chose high verbosity, the batch data expands to show individual items. At low verbosity, you only get the summary.
- At high verbosity, click an Engine network packet to zoom in on the task that deserialized the packet.
- Regardless of verbosity level, click any other Engine network event to show information such as size, direction, and type.
Compared to Engine network events, HTTP asset delivery shows some additional information, including batch size (if the request was batched) and the number of queued HTTP requests (if applicable). If you chose high verbosity, it also includes asset IDs for any assets in the request.
- Click the asset ID to zoom in on the task where the next step in fetching that asset took place.
- Click the + to view the asset on the Creator Store.

Additional graphs
Depending on the data included in the frame dump, you can view additional graphs below the standard download and upload graphs:
- Asset fetching
- Data
- Large replicator data (async and chunked data)
- Physics
- Terrain
Click any category in the legend to add these graphs, which provide dedicated views into each packet type. Each graph defaults to showing received traffic (Rx), but you can use the label in the upper-left of any of the three graphs to swap to sent traffic (Tx).
