
Source: Roblox Creator Hub · CC BY 4.0 · View source · Code samples: MIT Imported 2026-10-03. Formatting adapted for this site.
Get started with analytics
Analytics help you understand how players interact with your game so you can make better design decisions. Instead of relying on guesswork or anecdotal feedback, you can use metrics to identify patterns, evaluate changes, and continuously improve your game.
This guide explains how to think about analytics: how metrics can answer questions about your players, how they help you ask better questions, and how to use them when deciding what to build next.
Use metrics to answer questions about your players
Metrics provide signals about what players are doing in your game. By tracking key behaviors, you can answer questions such as:
- **Are players enjoying a specific part of the game?**
- - Look at early-session retention or completion rates for onboarding content. - If you notice that many players leave shortly after joining, that metric may indicate an issue with onboarding, difficulty spikes, or unclear goals. - Measure how often players interact with recently added systems or content. - For more information, see [engagement metrics](#engagement-metrics).
- **Where do players stop progressing?**
- - Funnel or progression metrics can show where players drop off. - For more information, see [retention metrics](#retention-metrics).
- **Are monetization systems working as intended?**
- - Track purchase rates, engagement with stores, or reward redemption. - For more information, see [monetization metrics](#monetization-metrics).
Metrics alone don't always provide the full explanation, but they help reveal where to look more closely. Once you understand how to leverage metrics to answer questions about your users, dive into specific user cohorts using segmentation and filtering filters and test any changes incrementally.
Engagement metrics
Engagement metrics reveal how often and for how long players are interacting with your game. Three of the most important engagement metrics are:
Daily active users (DAU): The daily active users metric tracks the number of players that are in your game for a given day. This is a great way to understand the overall health of your game over time. If you have 1,000,000 players one day, and a few days later you see a downtrend to 500,000, you can identify a problem and begin troubleshooting.
Monthly active users (MAU): The monthly active users metric tracks the number of players that are in your game for a given month. This metric shows a month-over-month trend and can be used to compare user activity on larger time frames. For example, some months have increased player traffic due to seasonal events and holidays. If your monthly active user number is lower last October compared to this October, it could provide insight that your Halloween event didn't satisfy your community.
Average session length: The average session length is how long a player plays your game on average from the start of their session to the time they log out. This metric helps you design content to fit within that window of time to ensure your game can be enjoyed by the majority of your players. The average session length also serves as a health metric. If the average session length fluctuates after a significant update or seasonal event, it can inform you how your latest content was received.
Note
For out-of-the-box functionality to create engagement rewards, see the Engagement rewards feature package.
Retention metrics
Retention metrics determine if players are returning to your game. Three of the most important retention metrics are:
Day 1 (D1) retention: Day 1 retention measures how many players return to your game on your second day (D1) from the first day they play your game (D0). A low D1 is indicative of low retention, often as a result of a poor user onboarding game. This usually means the player is confused or frustrated, or they're not getting to the fun fast enough. To learn more about how to design an effective onboarding experience, see Onboarding.
Day 7 (D7) retention: D7 retention tracks the number of players who return to your game after 7 days. If this number is low, it's often indicative of a poor progression system, with players not having a tangible reason to see themselves playing your game a week from when they started.
Day 30 (D30) retention: D30 retention tracks the amount of players who return to your game after 30 days. If this number is low, it's often indicative of a lack of end-game content or lack of an end-game goal. Consider if you have enough content at the end of your game for seasoned players, be it quests, social aspects, or narrative elements.
Monetization metrics
Monetization metrics indicate much how revenue your game is generating. Three of the most important monetization metrics are:
- Average revenue per daily active user (ARPDAU): ARPDAU is the average amount that players spend in your game. This is a good snapshot of overall health of the game. Consider if there are successful systems in your game that encourage your players to spend.
- Conversion rate: The conversion rate is considered one of the most important metrics. The conversion rate is the percentage of all users who have spent any amount of money at all in your game. The reason why this is one of the most important metrics is that if a player makes an initial purchase, they are much more likely to make a purchase again in the future. Consider if your monetization practices encourage your players to spend.
- Average revenue per paying user (ARPPU): The ARPPU metric tracks the total amount spent for all players in your game, known as spend depth. This tells you if players in your game are motivated to spend a lot, a little, or somewhere in between. If this number is low, it's often indicative of purchase item value not being correctly optimized.
To learn how to design systems that increase all of these metrics and encourage players to spend money in your experience, see Monetization foundations.
Segmentation and filtering
When viewing your game's analytics, you can filter your user data by segments that allow you to understand the behavior of a subset of users. This lets you filter your metrics by various characteristics, such as:
- **Active payer status**
- Go to Monetization > Overview.
- Select Breakdown by > Active Payer Status on the chart. Cross check this across various Time intervals.
- If the top 15% contributes significantly less than expected, you may have opportunities to better retain or monetize top spenders.
- If the top 15% contributes significantly more, you may need to strengthen the value proposition for mid- and lower-tier spenders.
- **When user first played**
- Navigate to Analytics > Engagement.
- Select Breakdown by > When user first played. Check your data across various Time intervals.
- Stable or growing cohorts indicate healthy long-term engagement.
- Declining cohorts highlight areas that may need attention.
- **Platform spender status** Segmenting metrics by **Platform spender status** helps you understand how players who spend Robux across Roblox interact with your game.
- Navigate to Analytics > Acquisitions.
- Under Platform spender status, enable the Active spender filter and click Apply.
Segmenting metrics by Active payer status helps you understand how revenue is distributed among paying players.
In many games, a small group of players generates a large share of revenue. On average, the top 15% of active payers account for roughly 50% of revenue. To analyze this in your own game dashboard:

Based on this information, you can identify opportunities to improve your game for various groups of spenders:
Note
You can also review Average Revenue Per Paying User (ARPPU) on the same page. Top payers typically spend several times more than other segments. If ARPPU is low or declining, your game may lack compelling ways for top players to continue spending.
To evaluate engagement, go to the Engagement page and select Breakdown by Payer Status. Review metrics such as DAU, WAU, MAU, and Average Playtime to see whether this payer segment remain stable over time.
Segmenting players by When user first played helps you evaluate the health of different player cohorts who started playing your game at different times.
In newly launched games, most DAU comes from players who joined recently, typically within the first 30 days. Strong acquisition channels and early retention are especially important during this stage.
As a game matures, long-term growth depends increasingly on retaining and re-engaging existing players. Over time, older cohorts should represent a larger share of active users. To analyze this in your own game dashboard:
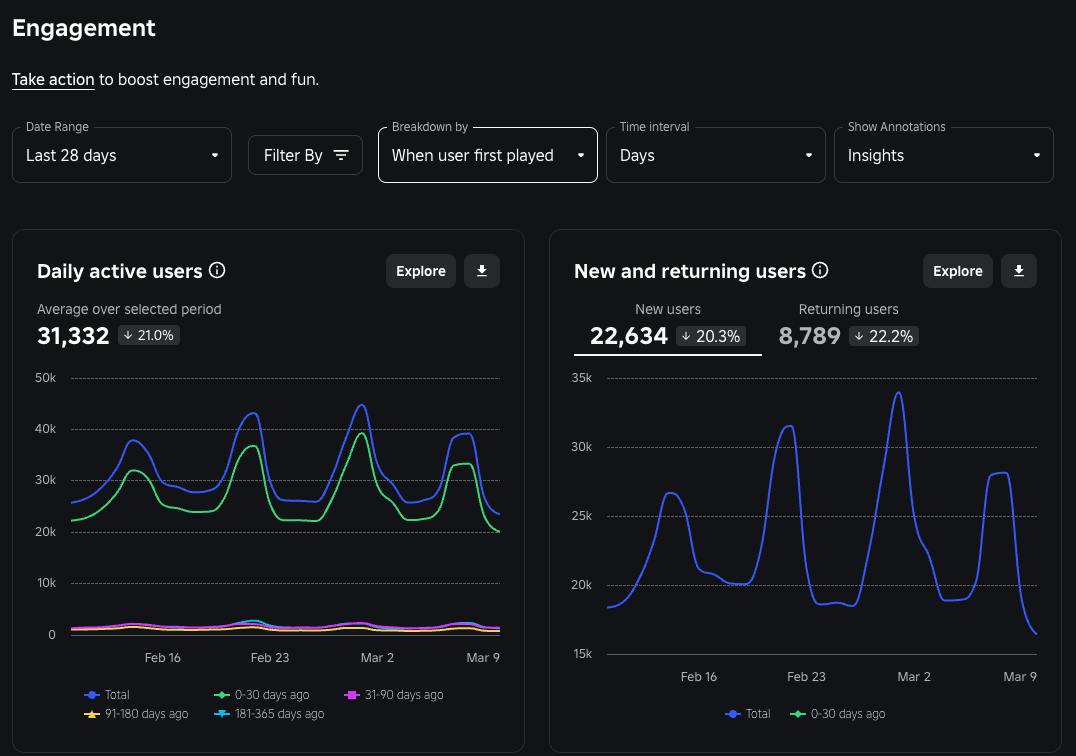
Based on this information, you can identify opportunities to improve your game for various groups of users:
For example, if the 0–30 day cohort remains stable but the 181–365 day cohort declines, acquisition may be healthy while long-term players are disengaging. In this case, consider introducing new content, events, or gameplay updates to encourage players to return.
This segment is also relevant for Daily Engagement Rewards, which provide a bonus each day an Active Spender plays your game. To analyze this in your own game dashboard:
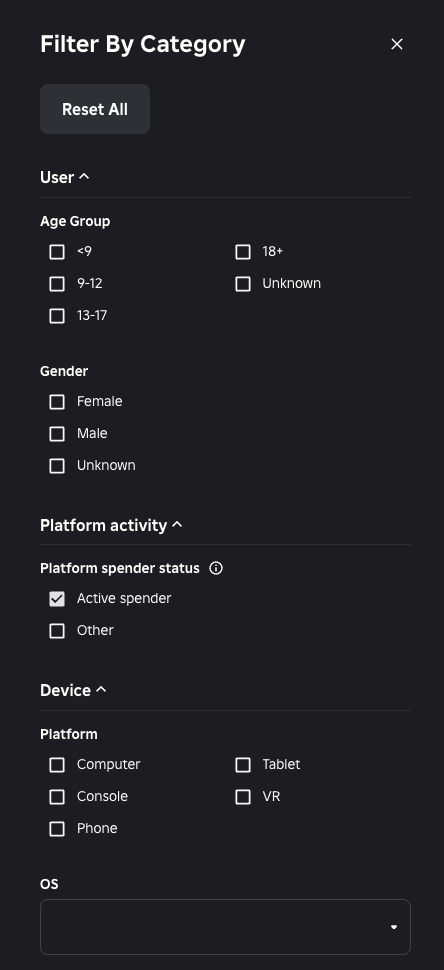 1. Review **Unique users with plays by source**.
The Unique users with plays by source graph, unfiltered.
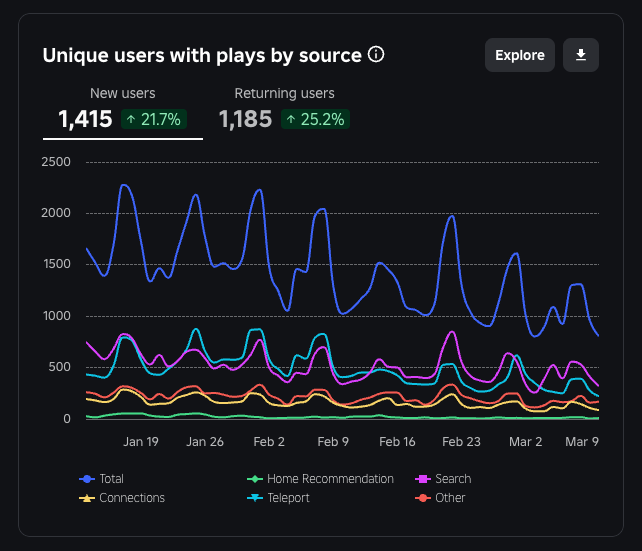
The Unique users with plays by source graph, filtered by Active platform spenders.
Active spenders typically retain better than average players. Declines in this segment may indicate opportunities to improve engagement for highly invested players.
Since Daily Engagement Rewards require active spenders to spend at least 10 minutes in your game, you should also verify your Engagement > Average Playtime statistics. If average playtime is close to or below this threshold, many players may not meet the requirement.

This graph indicates the average active payer is not staying long enough to qualify for Daily Engagement Rewards
You may also want to monitor the share of Active Spenders within DAU, WAU, or MAU over time. Declines in either total numbers or percentage share may indicate shifts in your audience or opportunities to strengthen engagement.
Note
For a full list of metric filters, see Dashboard filter by metrics.
Make incremental changes and measure results
Analytics can help identify opportunities to improve your game, but changes are most effective when introduced gradually and measured over time.
Instead of making large updates all at once, consider testing smaller adjustments and observing how player behavior changes. This approach makes it easier to understand which changes have a meaningful impact. Use the following tools to support this workflow:
- Experience configs - Allows you to adjust values in your game without publishing a new version. You can use configs to tune gameplay systems, progression rates, rewards, or other parameters while your game is live.
- Experiments - Allows you to test different versions of a feature with separate groups of players.
Using analytics, configs, and experiments together creates a continuous improvement loop:
- Analyze metrics to identify opportunities.
- Make a targeted change using configurations or experiments.
- Monitor the results across relevant metrics.
- Repeat to continue refining the game.
This process helps you make informed decisions and improve your game based on real player behavior.