Source: Roblox Creator Hub · CC BY 4.0 · View source · Code samples: MIT Imported 2026-10-03. Formatting adapted for this site.
Feedback
Listening to feedback from players and the community is a great opportunity to improve your game — what they love, what they wish could be improved, etc. The Feedback dashboard is one tool that can help you disseminate player feedback.
Note
This dashboard is new and only includes data from a limited time period. Game upvotes/downvotes are factored from February 1, 2025 and onward, while comments are logged from March 17, 2025 and onward.
To view your game's feedback analytics:
- Navigate to your Creations page and select your game.
- In the Audience menu on the left, select Feedback.
Note
You can view feedback for both individual and group-owned games. To view the latter, you need to have the View analytics for experiences permission within the group.
To dive deeper into player feedback, see the feedback insight reports.
Chart view
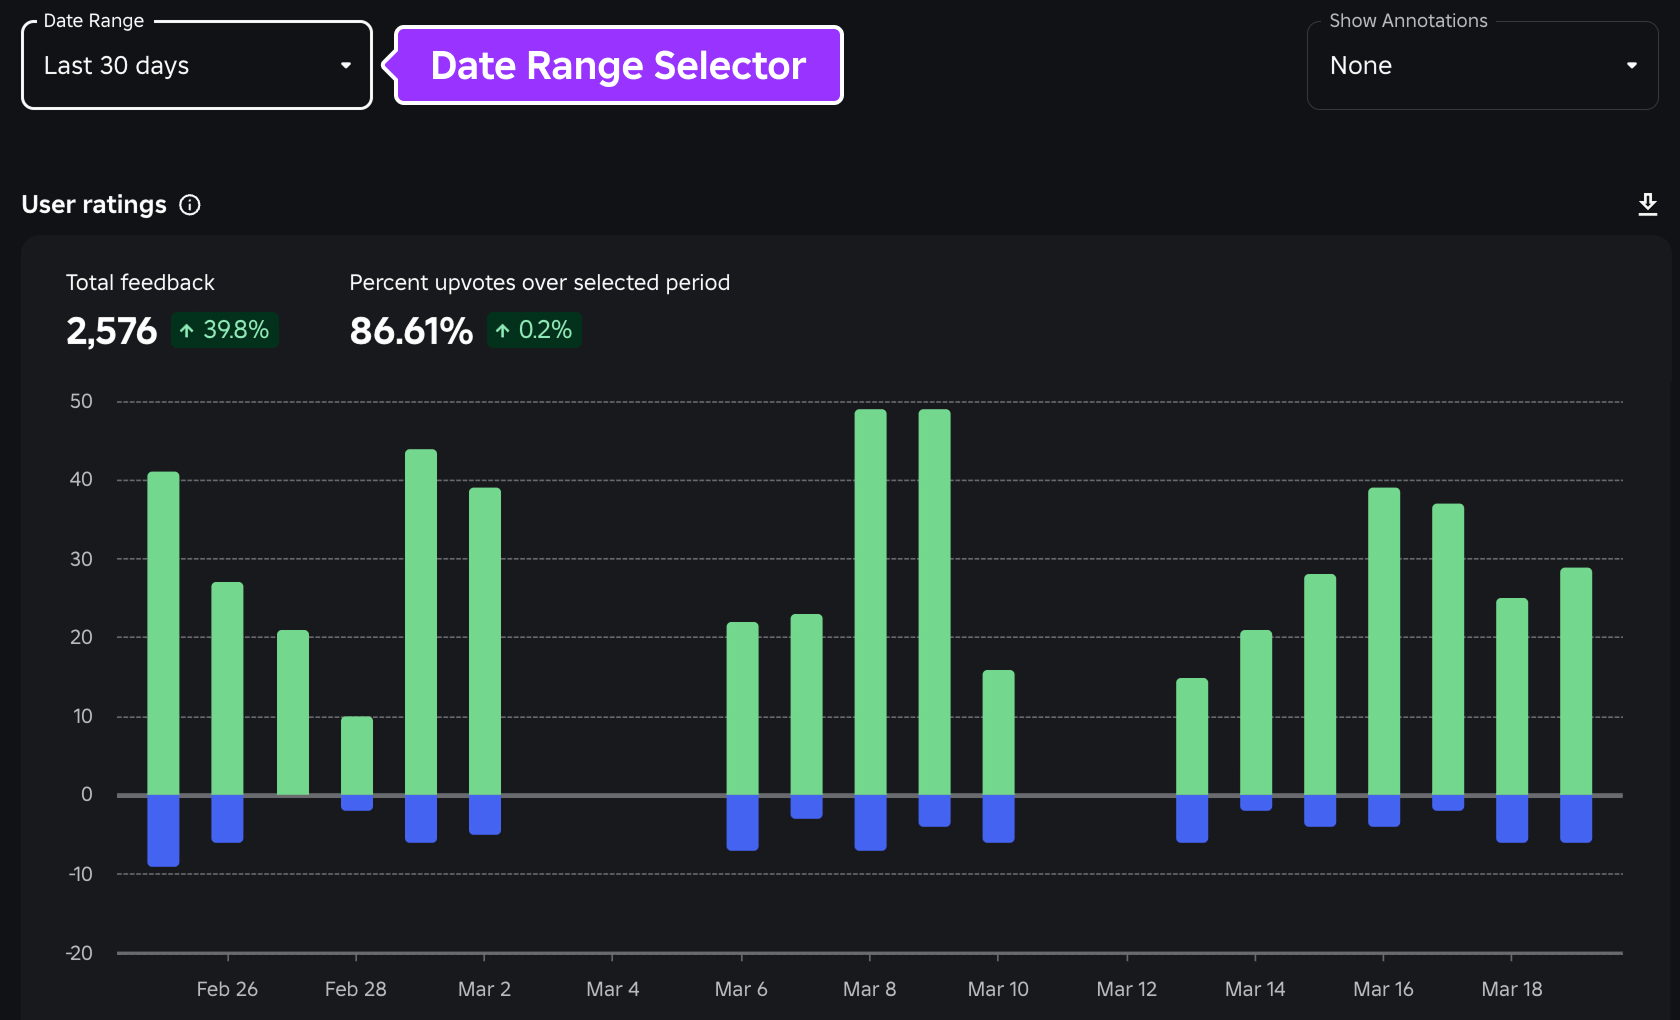
The chart view shows a detailed breakdown of ratings on your game, showing trends in sentiment over time. This view:
- Shows trends in player sentiment over time.
- Helps you identify issues like a new update causing a sudden spike in downvotes.
- Helps you make improvements and monitor how those changes influence player sentiment.
In the chart, you can adjust the range of total feedback using the Date Range selector, allowing you to view feedback within 7/30/60/90 days, or select a specific custom date range.
Above the chart is a summary of the feedback across the selected date range:
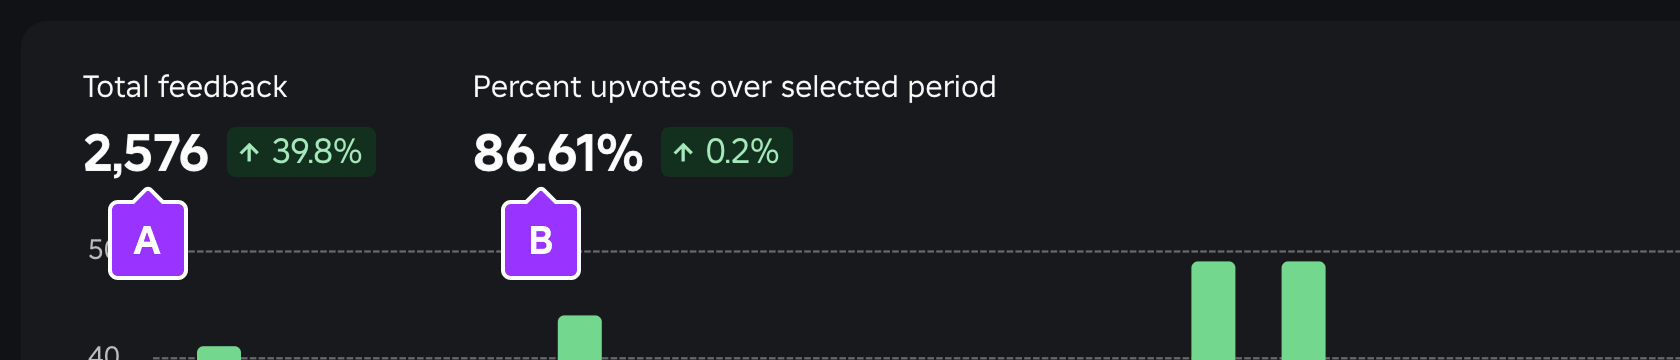

**Total feedback** — Total votes (upvotes and downvotes) for the date range.
**Percent upvotes over selected period** — Percentage of upvotes vs. downvotes for the range.Note
Note that players can change their rating at any time. Also note that ratings update at the end of each day and may not reflect the current core rating on your game.
To the right of each core value is a relative percentage of improvement or regression based on the previous range. For example, a relative percentage for the last 30 days shows improvement/regression for those 30 days as compared to the 30 days before that. Hovering over a relative percentage reveals the exact date range used for calculation:

Detailed view
The detailed feedback table shows specific feedback submitted by players who have played and rated it from the game's detail screen.
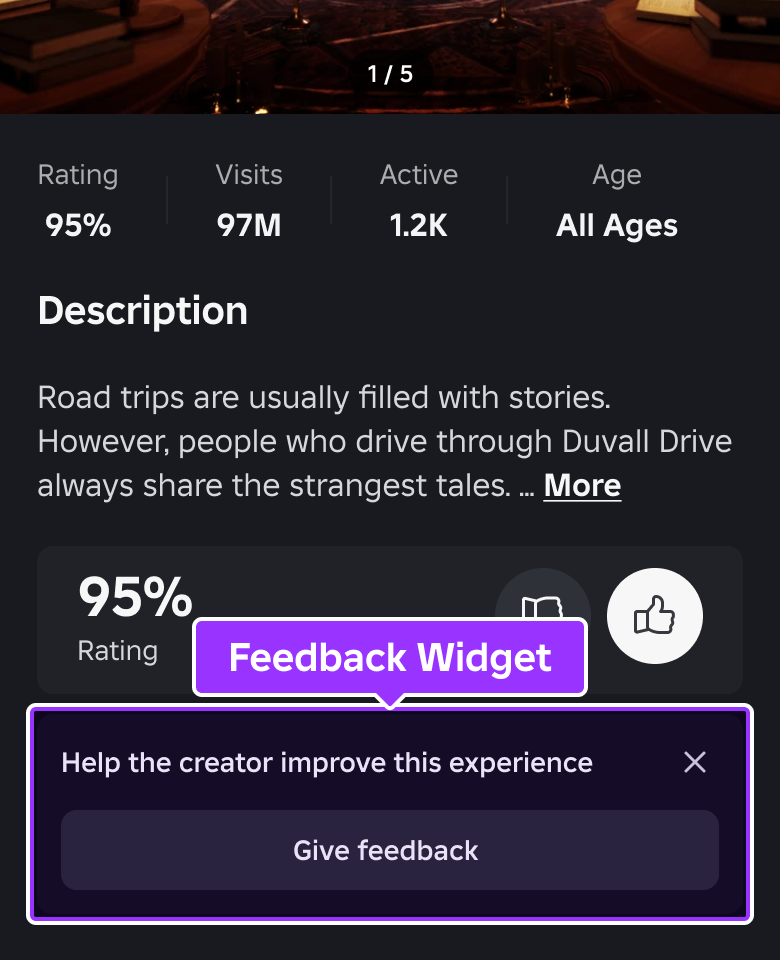
Each row in the feedback table includes:
- Rating — Upvote (positive) or downvote (negative). This reflects the player's rating at the time they provided the feedback, although they may change their rating later.
- Device Type — Which device type the feedback was provided from: computer, phone, tablet.
- Platform — Which OS or platform related to the device, for example iOS or Windows.
- Comment — Specific player feedback related to the vote. For safety reasons, all comments are sent through a text filter and will not appear if they get filtered.
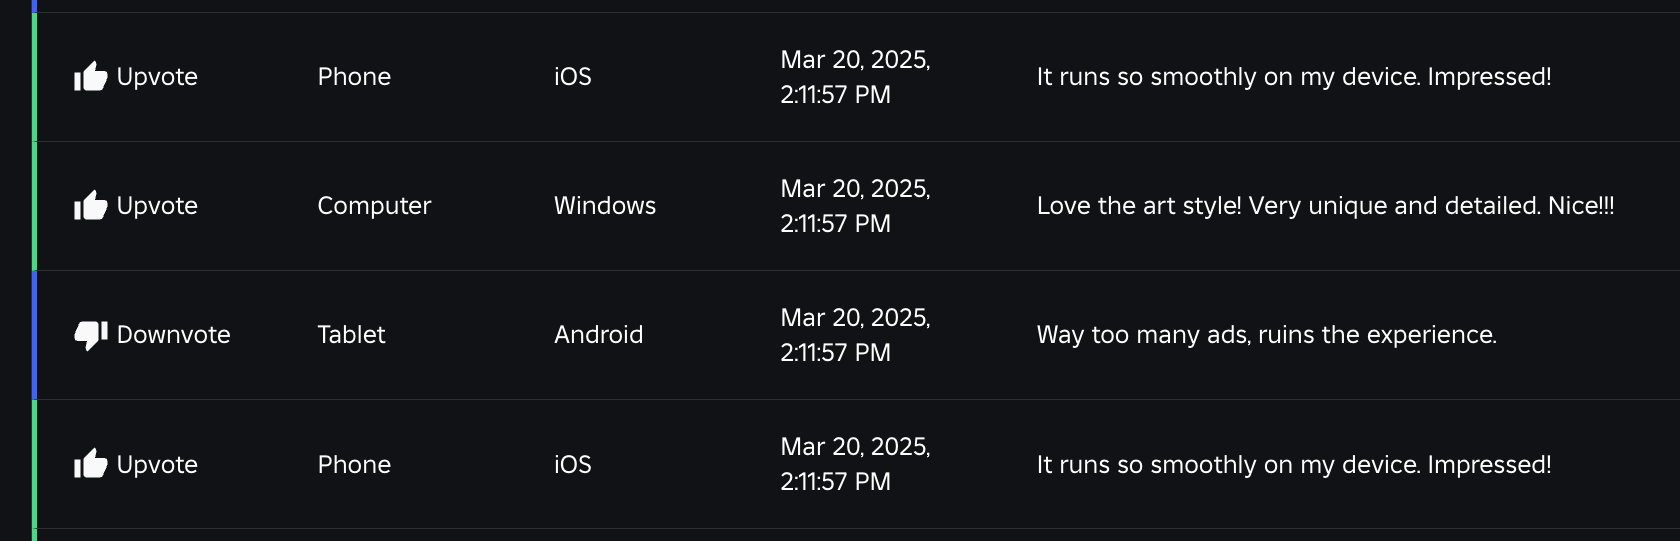
Note
Feedback comes in many shapes and sizes. Some players may leave a downvote but then provide useful suggestions in their comments. Make sure you read all the feedback!
Hovering over any row and clicking the options button (⁝) reveals the option to report feedback and hide it from your dashboard. Once reported, you will not be able to see the feedback again.

Data export
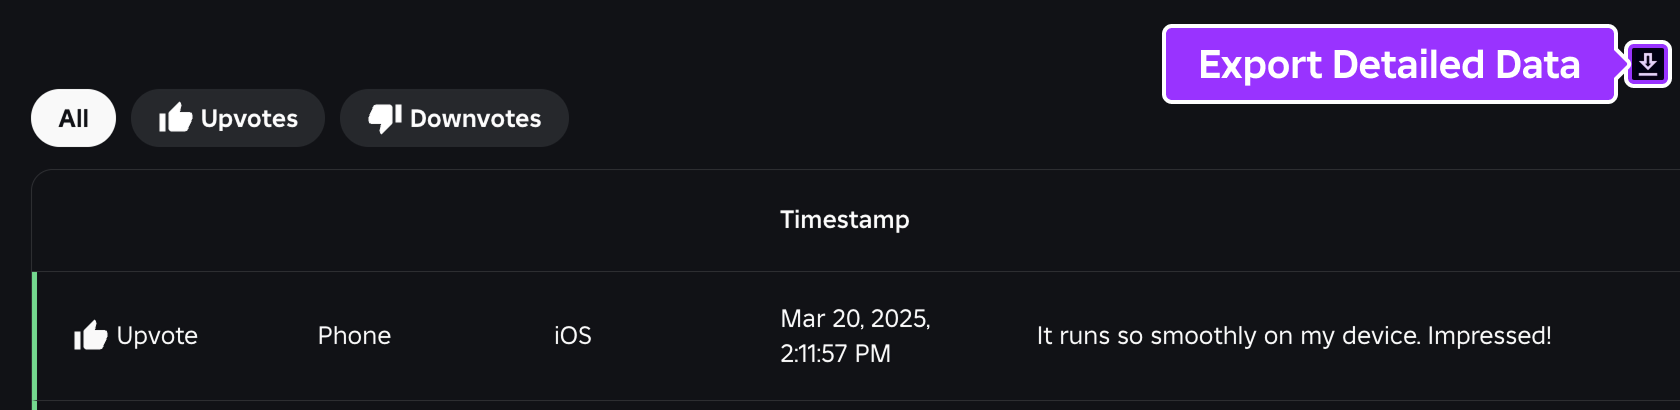
To the upper-right of both the chart and detailed views, the export button allows you to export feedback data in .csv format, useful for parsing or processing data in external applications.