
Source: Roblox Creator Hub · CC BY 4.0 · View source · Code samples: MIT Imported 2026-10-03. Formatting adapted for this site.
Developer Console
The Developer Console is a tool for debugging your game when testing in Studio or running it in production. It shows log messages and errors similar to the Output window and detailed information on Memory, Network, and more.
You can open the console during a testing or live game session using any of the following ways:
- Press F9.
- Type
/consoleinto the chat. - Use the in-game menu:
Open the in-game Roblox Menu.

Select the Settings tab.
Scroll down to Developer Console and click Open.
Console sections
The shortcut bar at the top of the console shows the number of critical errors and warnings, client memory usage, and average ping time; click any of these to jump to its corresponding section in the console. Below the shortcut bar is a series of tools as outlined below.

Log
The Log tool shows diagnostic messages from scripts.
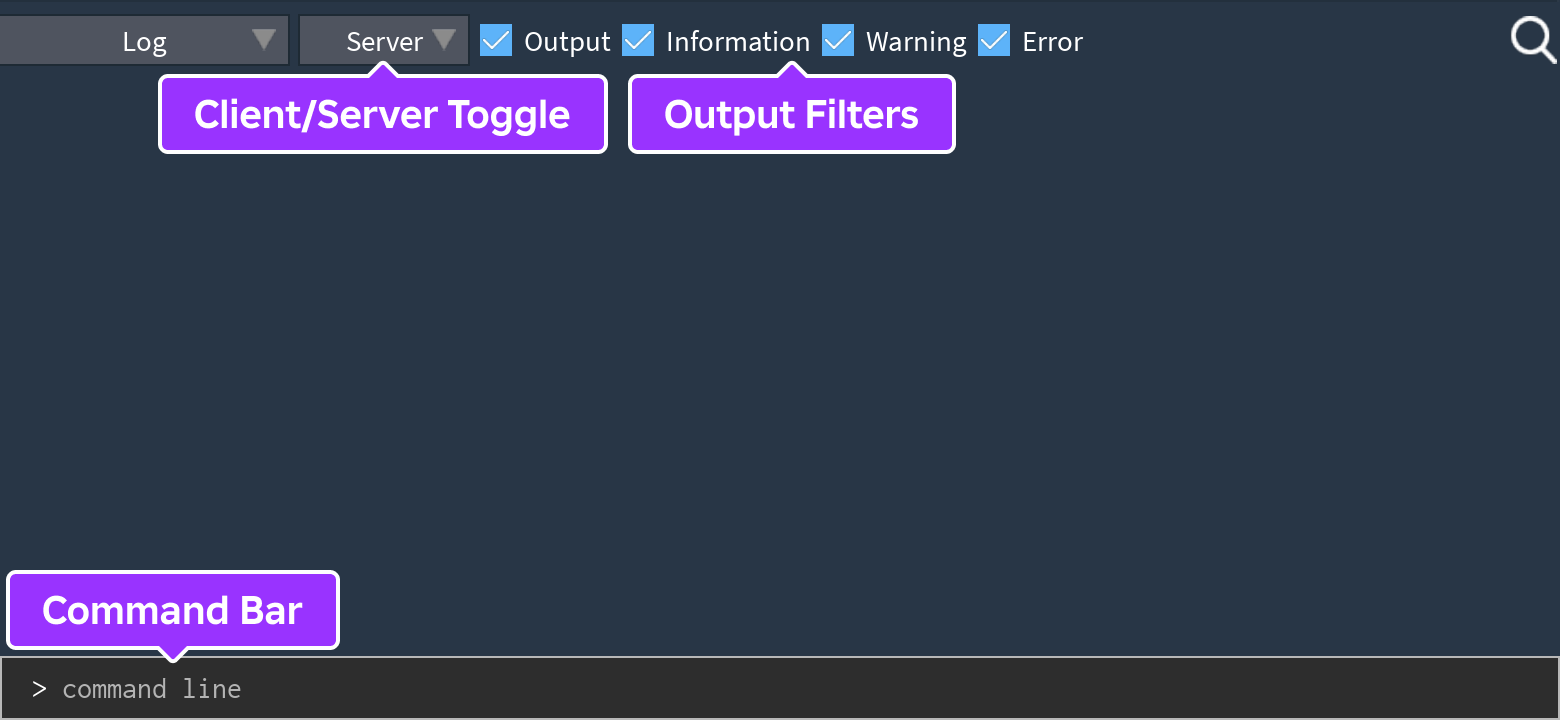
Client/server toggle
Using the client-server switch, you can toggle between Client and Server views:
- The Client view shows output from client-side
LocalScriptsand/orScriptswithRunContextset toRunContext.Client. Anyone running a game can view local output messages. - The Server view shows output from server-side
Scripts(RunContextset toRunContext.ServerorRunContext.Legacy). Only the game owner or group members with editing permission can view server output messages.
Output filters
Using the checkboxes, you can filter output messages in the log:
| **Output** | Messages generated by calls to [`LuaGlobals.print()`](/docs/luau-globals#print) and [`RobloxGlobals.warn()`](/docs/roblox-globals#warn) statements within scripts. |
| **Information** | Messages generated by the game that aren't errors or custom output statements. |
| **Warning** | Messages that indicate a potential problem but not a critical issue. |
| **Error** | Messages that indicate that something critical has happened. |
Command bar
The Server view also includes a command bar that lets users with editing permissions run arbitrary Luau code. Unlike the Command Bar in Studio, this console command bar has the same security restrictions as Scripts and LocalScripts, so it can't run protected functions.
Memory
Developer Console provides two tools for monitoring memory usage, including:
Memory — View real-time memory consumption by usage categories, including memory usage by both your custom components and the engine internal processes.
Luau heap — Create snapshots on the heap memory, which refers to the memory allocation to your scripts. This tool provides various memory allocation views to help you identify current memory allocation and issues from different perspectives, such as object types and engine classes. It also allows you to create multiple snapshots to compare differences in memory usage over time.
For more information, see Memory Usage
Network
The Network tool shows the number of web calls that the game has made. This includes explicit calls made through HttpService and web requests made by Roblox services like DataStoreService. The Network tool has two sections:
The Summary section lists a summary of all the web calls by type. Each type has details on the number of requests, the number of failed requests, and the amount of time that the request took.
The Details section lists each individual web call. Each row shows the HTTP method, such as
GETorPOST, along with the status code, time to execute, request type, and request URL. Click on a web call to see its response details, for example:{"Version":"1.1":"Content":{"Headers":[]},"StatusCode":"OK","ReasonPhrase":"OK","Headers":[],"TrailingHeaders":[],"RequestMessage":null,"IsSuccessStatusCode":true}
Script Profiler
The Script Profiler tool allows you to record profiling sessions of all running scripts and view their CPU time costs with custom recording and display settings. It's helpful for identifying scripts that take up the most CPU resources and slow down the performance. For more information, see Script Profiler.